







Monitor subgroup averages and ranges together to detect shifts in process average and variation using X-bar R charts.
Statistical Process Control (SPC)
Turn Process Data Into Better Decisions
Quality improves before failure occurs. Spectrum’s statistical process control (SPC) makes process variation visible by transforming LIMS and processing data into real‑time insight. With built‑in statistical analysis and charting, teams can monitor trends, detect drift early, and maintain consistent, controlled performance across manufacturing operations.
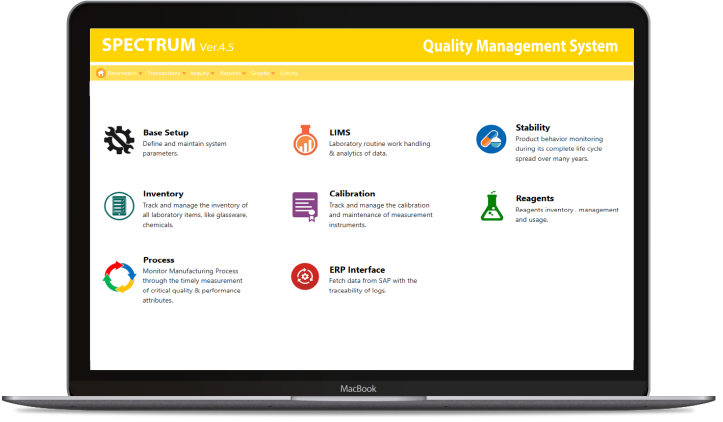

Built-In SPC Across Quality Data
Analyze the data you already have
Spectrum’s SPC is built into Spectrum’s LIMS and stability management system, allowing teams to generate statistical charts from analytical test results and raw data readings already captured in the system to prepare multiple trend analysis for better results. Users can select the date range, sample range, and tests they want to analyze, making it easier to create targeted charts without relying on external spreadsheets.

Control Charts for Process Behavior
See variation before it becomes a bigger problem
Spectrum uses control charts, also described as process-behavior charts, to help teams understand whether a process is stable, predictable, and operating within statistical control. When variation starts to shift, the chart patterns help reveal where attention is needed so teams can respond earlier and manage the process with more confidence.

Capability Analysis That Connects Quality to Performance
Measure how well the process meets the requirement
With capability analysis including Cpp and Cpk, Spectrum’s QMS helps teams evaluate how effectively a process is performing against specifications. Once a process/product is in statistical control, capability analysis gives a stronger basis for process improvement and helps quantify progress over time.
More reasons to switch with Spectrum
X Bar – R Charts
p-Chart Analysis
Track the percentage of defective items in attribute-based data where outcomes are yes/no, conform/non-conform, or pass/fail.
X Bar – s Charts
Analyze subgroup averages and subgroup standard deviations together for variable data when standard deviation is the better measure of variation.
Root Cause Linkage
When a process drift is identified, link the SPC event directly to an investigation or Deviation record for seamless traceability.
Historical Audit Ledgers
Maintain a permanent, timestamped record of all process data and statistical adjustments to meet 21 CFR Part 11 requirements.
s Charts
Detect variation shifts by measuring subgroup standard deviation across the process using S charts for clearer SPC monitoring.
Pareto Prioritization
Focus improvement effort where it matters most by separating the vital few issues from the trivial many using Pareto analysis.
Histogram Analysis
Understand how process data stacks up over time with histograms that reveal the spread, shape, and location of a distribution.
Detailed Calculation Reports
View detailed chart reports with values and calculations that support visual analysis and improve confidence in SPC results.
Date and Sample Range Selection
Generate charts using the specific samples, dates, and tests relevant to the question at hand, helping teams move from broad data sets to focused process insight.
Support for Continuous Improvement
Spectrum helps teams use SPC not just to observe the process, but to maintain control, reduce variation, and support ongoing improvement efforts over time.
FAQ
Frequently Asked Questions
Spectrum can generate SPC statistical process control charts from analytical data in Spectrum’s LIMS and Spectrum Process, including test results and raw data readings where applicable.
Yes, users can select the range of samples or dates, along with the tests on which the chart is to be created.
Spectrum’s statistical process control documentation confirms chart types, including X Bar – R, p chart, X Bar – s, s chart, Pareto, Histogram, and capability analysis using Cp and Cpk.
Capability analysis helps measure how effectively a process meets customer specifications and supports process improvement efforts once the process is in statistical control.
Spectrum’s total quality management platform helps teams monitor variation, determine whether a process is in statistical control, and use that information to maintain control and reduce future variation.
Helping Businesses of all Sizes for 32+ Years
Leading Fortune 500 companies trust our enterprise solutions for HR, payroll and quality























































Testimonials
What They Say About Us
A reliable partner for smarter laboratory management.
Working with Sofcom has been a rewarding experience. Spectrum has proven to be a valuable solution for managing laboratory operations, helping us improve data analysis and support better decision-making.
I look forward to Sofcom’s continued innovation and the positive impact their solutions will have on the pharmaceutical industry.


